Voronoi Diagrams: Difference between revisions
Jump to navigation
Jump to search
No edit summary |
No edit summary |
||
| Line 24: | Line 24: | ||
|} | |} | ||
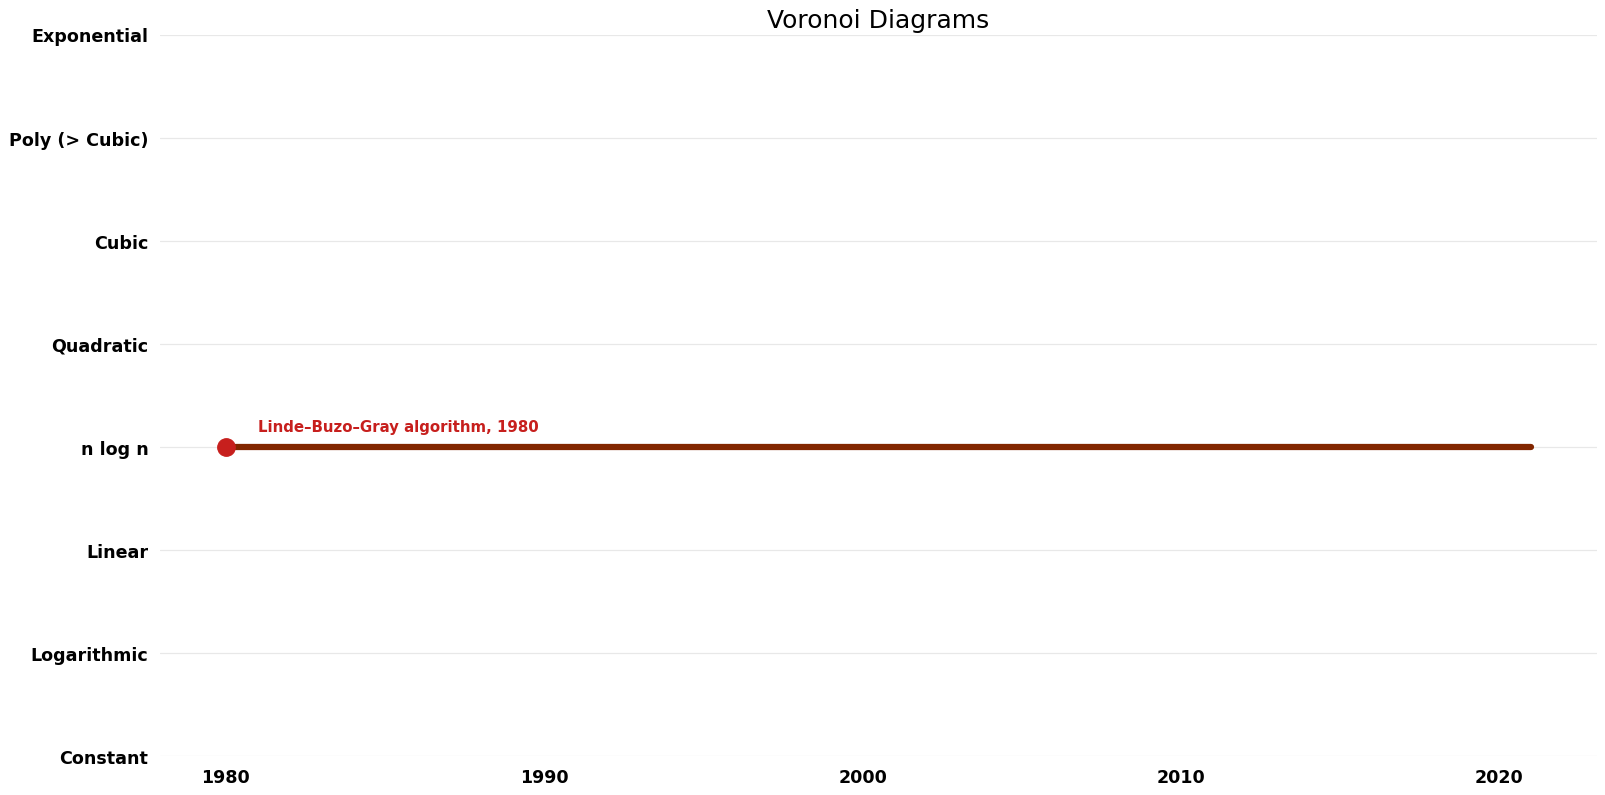
== Time Complexity | == Time Complexity Graph == | ||
[[File:Voronoi Diagrams - Time.png|1000px]] | [[File:Voronoi Diagrams - Time.png|1000px]] | ||
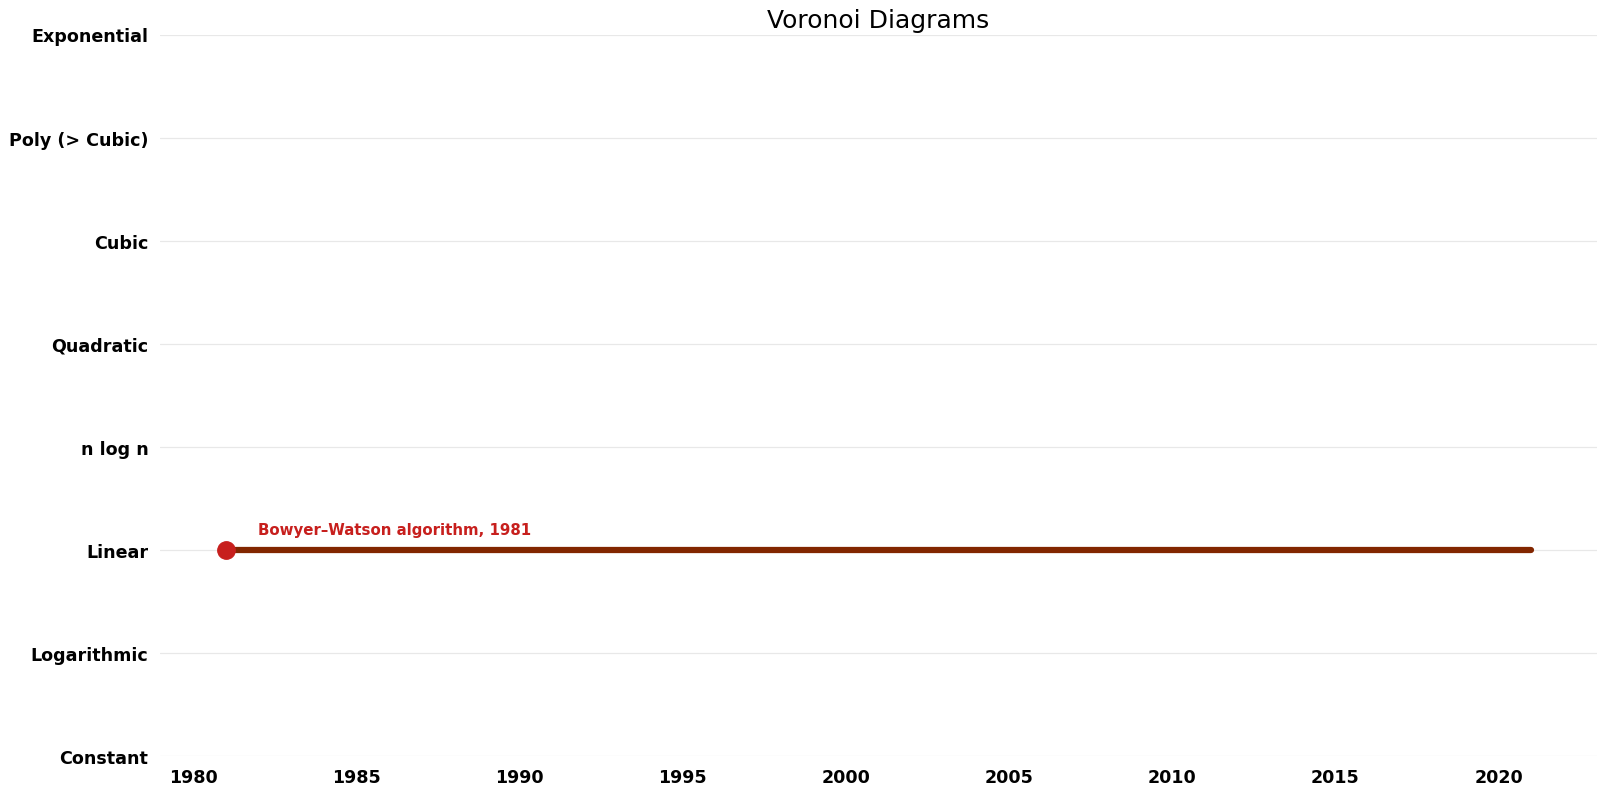
== Space Complexity | == Space Complexity Graph == | ||
[[File:Voronoi Diagrams - Space.png|1000px]] | [[File:Voronoi Diagrams - Space.png|1000px]] | ||
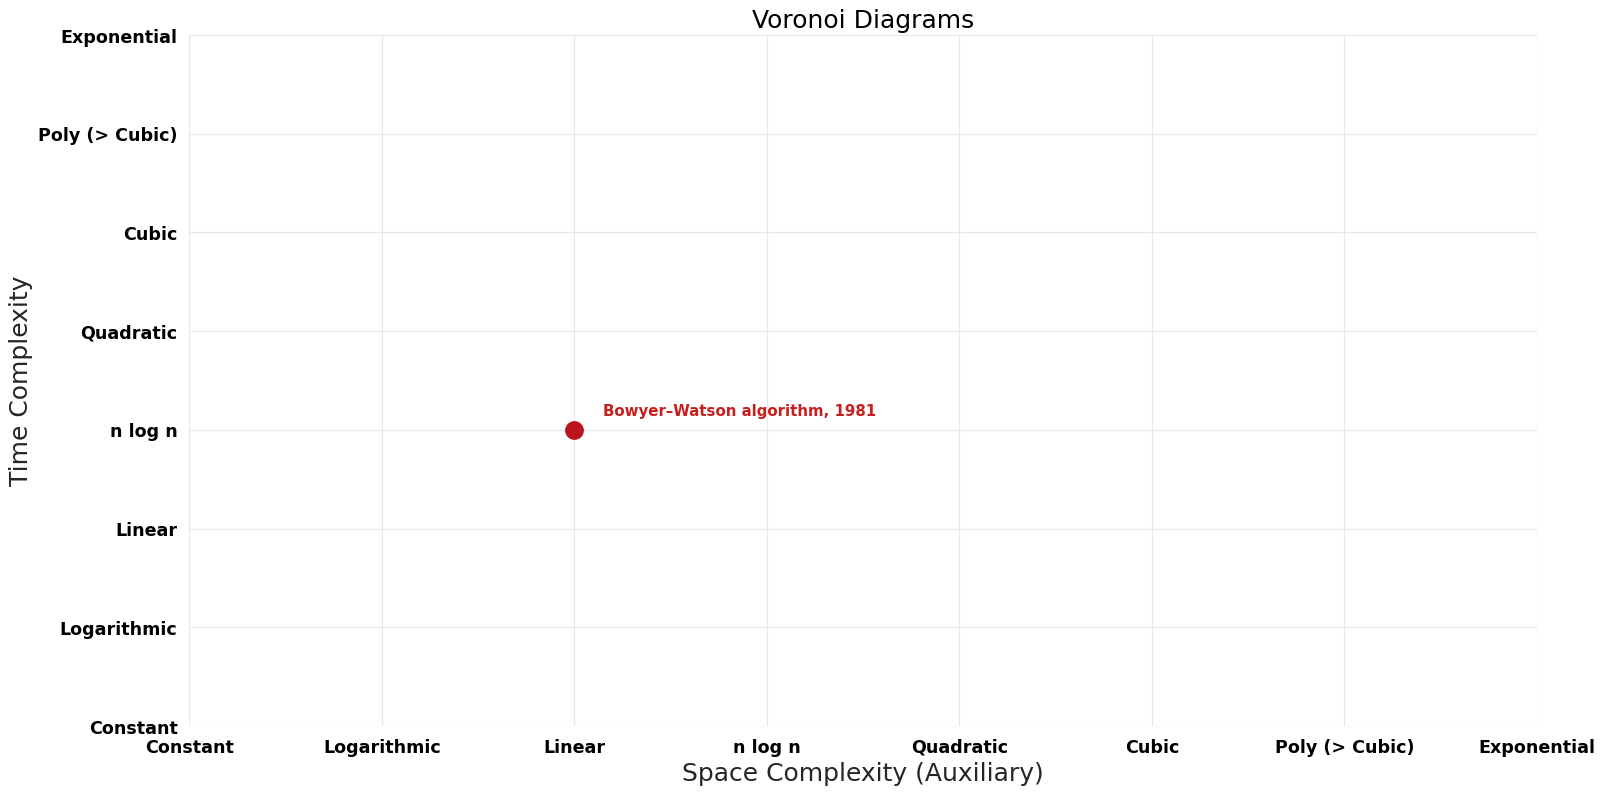
== Pareto | == Pareto Frontier Improvements Graph == | ||
[[File:Voronoi Diagrams - Pareto Frontier.png|1000px]] | [[File:Voronoi Diagrams - Pareto Frontier.png|1000px]] | ||
Revision as of 14:04, 15 February 2023
Description
Given a set of n points in 2-dimensional space, compute the Voronoi diagram with the n points as seeds.
Parameters
n: number of points
Table of Algorithms
| Name | Year | Time | Space | Approximation Factor | Model | Reference |
|---|---|---|---|---|---|---|
| Fortune's algorithm | 1986 | $O(nlogn)$ | $O(n)$ auxiliary | Exact | Deterministic | Time & Space |
| Linde–Buzo–Gray algorithm | 1980 | $O(nlogn)$ | Exact | Deterministic | Time | |
| Bowyer–Watson algorithm | 1981 | $O(nlogn)$ | $O(n)$ auxiliary | Exact | Deterministic | Time |


